基于BIOMOD的黄河源区黄帚橐吾分布
English
-
黄河源区位于青藏高原东北边缘,是我国重要的水源涵养地[1],也是青藏高原最主要的畜牧产业基地之一。高寒草地是该地区主要的自然资源和生态环境载体,约占源区总面积的80%[2-3]。20世纪70年代以来,受气候变化和人类活动的影响,黄河源区高寒草地退化趋势日益加重,随之导致植物群落结构的变化,尤其是毒杂草的泛滥已严重威胁到当地生态环境和畜牧业的可持续发展[4-5]。黄帚橐吾(Ligularia virgaurea)为多年生草本植物,广泛分布于黄河源区,是该区域最主要的毒杂草之一[6-8]。黄帚橐吾是典型的游击型克隆生长植物,其种群滋生蔓延可快速形成优势群落,进而降低植物物种多样性、加剧高寒草地退化、降低草地健康等级[9],因而其大量涌现通常被认为是草地退化的标志[10]。黄帚橐吾也通过化感作用抑制优良饲草生长[11],加之放牧管理方式下的竞争优势,极易导致畜产品产量和品质的下降[12]。因此,黄帚橐吾的过度蔓延将严重影响高寒草地生态系统及畜牧业的可持续发展[13]。另一方面,在生态环境恶劣区域,黄帚橐吾具有一定的固沙、防止土壤流失的作用[14]。因此,明确黄帚橐吾的时空分布及其关键影响因子对揭示其与黄河源区高寒草地可持续发展的关系具有重要应用意义。
物种分布模型(species distribution models, SDMs)基于生态位原理[15-17],依据物种是否存在,结合相关的环境变量构建模型判断物种的生态需求,进一步将结果投射到不同的空间和时间,从而评估和预测物种的分布[18]。近年来,基于R语言的物种分布集成预测平台BIOMOD (BIOdiversity MODelling)被广泛应用于物种分布研究[19-20],然而基础驱动数据的缺失是该模型应用的主要障碍。传统植物空间分布、群落大小以及演替趋势的研究主要通过地面调查完成[21]。因费时费力、效率低下以及标准难以统一等因素而难以开展区域尺度的调查研究。此外,在取样环境恶劣的区域,如在我国的青藏高原地区由于植物生长季短、分布范围广等原因[22],传统方法难以在有限的时间内完成大范围、统一标准的调查工作,而且在生态环境脆弱区可能因为观测过程中的碾压、践踏等活动对植物生境造成一定破坏[21, 23]。无人机(unmanned aerial vehicle, UAV)技术的出现为克服环境限制、高效获取生态学研究的数据提供了新的方法[24]。结合自动航拍控制和数据分析系统(如fragmentation monitoring and analysis with aerial photography, FragMAP)[24],无人机具备采样 (拍照) 时间短、覆盖范围广、野外可达不易到达的区域、可实现长期定点、无损监测等特点[25],为获取区域尺度、高精度的植物分布基础数据提供了全新的手段。目前,无人机技术已在植被覆盖度[25]、高原鼠兔总洞口和种群密度[26-27]、地上生物量[28]和植物种类[29]等领域被广泛应用,为区域尺度物种时空分布研究提供了一定的基础。
鉴于此,本研究应用FragMAP获取和提取黄帚橐吾的基础分布数据,并结合BIOMOD2物种分布模型集成平台,揭示黄河源区影响黄帚橐吾空间分布的关键影响因子,探析黄帚橐吾的潜在分布及其对气候变化的响应,旨在为该区域黄帚橐吾的致害等级划分和合理防治提供科学决策依据,也为青藏高原生态系统和畜牧业的可持续发展提供必要的理论和实践基础。此外,还可为草地生态系统生物多样性的研究和保护提供新方法和新手段。
1. 材料与方法
1.1 研究区概况
研究区为地处青藏高原东北部边缘的黄河源区(95°50′–103°30′ E,32°30′–36°10′ N) (图1),年均温−2.7 ℃,年均降水量517 mm,平均海拔4 100 m,具有昼夜温差大、降水季节性明显、水分蒸发量大及辐射性强等特征。研究区横跨青海、四川、甘肃三省,属对气候变化敏感的生态环境脆弱区[30]。研究区的优势植物以莎草科(Cyperaceae)和禾本科(Gramineae)为主,优势种有矮嵩草(Kobresia humilis)、垂穗披碱草(Elymus nutans)和青藏苔草(Carex siderosticta)等[31]。土壤以高寒草甸和草原土为主[32]。
1.2 数据获取
1.2.1 黄帚橐吾基础分布数据的获取
2018年7月 − 8月在研究区开展无人机航拍获取黄帚橐吾基础分布数据。共布设了224个工作点,313条航线( 图1和图2a)。利用南通大学脆弱生态环境研究团队自主研发的基于无人机的协同航拍和分析系统 (FragMAP) 设置航线和工作点(部分为前期设定航线,直接调用),控制无人机按照预定航线自动定点航拍(图2a)。航拍高度设置为2 m,飞行速度为3~5 m·s−1,航线的覆盖面积为1 600 m2(40 m × 40 m),单张照片的地面分辨率为0.55 mm。本研究使用大疆创新科技有限公司(深圳,中国)生产的Mavic Pro (3 000 × 4 000像素,续航时间23 min,机身重量734 g) 进行航拍。利用团队自主研发的Proposal-Classifier (基于Java语言)信息提取工具,基于航拍照片提取黄帚橐吾的基础空间分布数据(图3),即通过人工识别的方法提取黄帚橐吾存在/不存在数据,进一步通过R平台的BIOMOD模型进行空间分布模拟。
![]() 图 2 基于无人机的协同航拍和分析系统的Belt航线设置示意图(a)基于FragMAP系统的Belt模式的航拍路径;(b)随机选取15条航线的6、7、10、11航点放置样方框;(c)基于Belt模式获取的样方框区域的航拍照片。Figure 2. Belt mode based on FragMAP(a) the aerial route of the belt mode of the FragMAP system; (b) 15 routes were randomly selected, and 6, 7, 10, and 11 waypoints were selected for quadrats; (c) the aerial photograph of the quadrat area.
图 2 基于无人机的协同航拍和分析系统的Belt航线设置示意图(a)基于FragMAP系统的Belt模式的航拍路径;(b)随机选取15条航线的6、7、10、11航点放置样方框;(c)基于Belt模式获取的样方框区域的航拍照片。Figure 2. Belt mode based on FragMAP(a) the aerial route of the belt mode of the FragMAP system; (b) 15 routes were randomly selected, and 6, 7, 10, and 11 waypoints were selected for quadrats; (c) the aerial photograph of the quadrat area.![]() 图 3 基于无人机的协同航拍和分析系统的Proposal-Classifier工具提取黄帚橐吾信息Figure 3. Extracting information from Ligularia virgaurea based on the Proposal-Classifier of FragMAP system
图 3 基于无人机的协同航拍和分析系统的Proposal-Classifier工具提取黄帚橐吾信息Figure 3. Extracting information from Ligularia virgaurea based on the Proposal-Classifier of FragMAP system随机选择15条航线,在每条航线的6、7、10和11航点,试验人员在无人机的正下方放置样方框(0.5 m × 0.5 m,共60个样本) (图2b),完成航拍后观察并记录每一个样方框中黄帚橐吾的株数(图2c)。通过与人工辨别确定样方框是否存在黄帚橐吾的结果进行比较,以判定是否存在黄帚橐吾的基础株数(由未参与野外工作的试验人员完成)。
1.2.2 影响因子数据
基于前期研究,本研究选用了65个影响因子数据用于建模,主要包括以下数据类型:
1)气候数据:气候数据由中国科学院青藏高原研究所阳坤研究员团队提供[33-34],包括气温、降水量、辐射、湿度等的0.1°格网数据。以1 km空间分辨率,利用克里金插值法扩展到整个研究区,获得31个栅格图层[35]。
2)植被数据:区域尺度研究中地表植被特征(植物生存的小生境)主要通过植被指数表征[36],本研究使用的植被数据包括归一化植被指数(normalized difference vegetation index,NDVI)年平均值、最大值、最小值以及年较差,数据来源、涵盖时间及前期准备按照杜嘉星等[35]的计算方法完成。
3)地形数据:采用SRTM 90 m DEM数据获取数字高程数据、坡度和坡向数据。数据来自美国地质勘探局(www.usgs.gov),并使用QGIS Desktop基于数字高程模型(Digital elevation model, DEM)数据提取3个栅格图层[35]。
4)土壤数据:来自SoilGrids (www.soilgrids.org)的土层厚度、0.3 − 0.6 m土层有机碳含量以及0.3 m处土壤容重等8种主要土壤指标数据 [37],共8个栅格图层,分辨率为1 km[35]。
5)气候情景数据:本研究使用的气候情景数据为WorldClim (Global Climate Data)全球30 s分辨率的气候数据(www.worldclim.org/cmip5_30s)。使用北京气候中心气候系统模式(Beijing Climate Center Climate System Model version 1.1, BCC-CSM1.1)[38]气候模式构建在RCP4.5 [假定全球年度温室气体排放量以(CO2计)的峰值在2040年左右,随后下降]和RCP8.5 (到2100年时,空气中的CO2浓度比工业革命前的浓度高3~4倍)两种代表性路径浓度(representative concentration pathways, RCPs)下2050年(2041−2060年的平均值)和2070年(2061−2080年的平均值)的气候数据。包括气温、降水量、辐射、湿度等的0.1°格网数据,共19个栅格图层。
1.3 模型介绍
BIOMOD是基于R语言的用于物种分布集成预测的计算机平台,可处理一系列模型中计算方法的不确定性和物种–环境关系[19-20]。BIOMOD具备10种物种分布模型,可以通过不同指标计算模型精度来评估不同模型在研究区的适用性,从而筛选出最优模型。主要包含广义线性模型(generalized linear models, GLM)[39]、人工神经网络(artificial neural networks, ANN)[40]、广义加性模型(generalized additive model, GAM)[41]、广义增强回归模型(generalized boosted regression models, GBM)[42]、分类树分析(classification tree analysis, CTA)[43]、表面分布区分室模型(surface range envelope, SRE)[44]、随机森林(random forest, RF)[45]、弹性判别分析(flexible discriminant analysis, FDA)[46]、最大熵模型(maximum entropy, MaxEnt)[47]、多元自适应回归样条(multiple adaptive regression splines, MARS)[48]。本研究基于BIOMOD模型,先后模拟了黄河源区当前和未来气候情境下黄帚橐吾的空间分布特征。
1.4 模型检验
将样本集随机划分为两个子集(本研究分为70%和30%)。其中70%用于建模,30%用于模型的精度检验。模型精度检验的评估指标为真实技巧统计值(true skill statistics, TSS)和曲线下面积(area under the curve, AUC)。每种模型多次运行模拟后,取其平均值进行评估。
1.4.1 曲线下面积(AUC)
该指标来源于受试者工作特征曲线,被定义为该曲线与坐标轴围成的面积[49]。AUC的取值范围一般在0.5~1区间内,接近于0.5的模型则越接近于随机猜测,随着AUC值的增大模型的模拟效果越好。
1.4.2 真实技巧统计值(TSS)
计算公式为TSS = TPR − FPR。式中:TPR (true positive rate)为真阳性率,FPR (false positive rate)为假阳性率[50]。该指标的取值范围在0~1,指标值越接近于1,即真阳性率与假阳性率的差值越大,表示目标模型的模拟效果越好。
1.5 因子重要性确定
基于模型内置因子的重要性计算函数,定义包含全部因子的集合为参考数据集,而定义随机剔除单个环境因子后的集合为测试数据集。使用参考和测试集合预测后计算预测结果的相关性(默认为Pearson相关性)[35]。统计不同模型对解释变量各个因子重要性的平均值,并按平均值进行降序排列,获取影响黄帚橐吾分布的主要因子(综合考量变异系数)。
2. 结果与分析
2.1 黄帚橐吾基础分布
实地调查与航拍照片判定黄帚橐吾是否存在对比发现,如果以单株或者2株出现与否为依据判别黄帚橐吾是否存在(仅指无法清楚辨认的,如可清楚辨认1株即认为存在黄帚橐吾),对于缺乏实地观测经验的室内分析人员来说可能会出现较高的误判比率。当基础株数定位为3株及更多时准确率为95%以上(图4)。本研究以3株黄帚橐吾的出现作为判别存在的依据,即一条航线内出现3株及以上疑似黄帚橐吾植株时认定为该观测点存在黄帚橐吾,否则认定为不存在黄帚橐吾。在224个观测点中有26个黄帚橐吾存在点和198个不存在点(图1),即在12%的观测点有黄帚橐吾出现。
![]() 图 4 不同基础植株数量判定黄帚橐吾出现与否的准确率+ 表示将没有黄帚橐吾的样方框认定为存在(第一类误差);○ 表示认定正确;− 表示将有黄帚橐吾的样方认定为不存在(第二类误差)。Figure 4. The accuracy rate of the presence/absence data of Ligularia virgaurea based on different plant numbers+ means “no L. virgaurea” was mistakenly identified as “L. virgaurea” (type Ⅰ error); ○ means identified correctly; − means “L. virgaurea” was identified mistakenly as “no L. virgaurea” (type Ⅱ error).
图 4 不同基础植株数量判定黄帚橐吾出现与否的准确率+ 表示将没有黄帚橐吾的样方框认定为存在(第一类误差);○ 表示认定正确;− 表示将有黄帚橐吾的样方认定为不存在(第二类误差)。Figure 4. The accuracy rate of the presence/absence data of Ligularia virgaurea based on different plant numbers+ means “no L. virgaurea” was mistakenly identified as “L. virgaurea” (type Ⅰ error); ○ means identified correctly; − means “L. virgaurea” was identified mistakenly as “no L. virgaurea” (type Ⅱ error).2.2 模型精度评估
BIOMOD运行结果中,除了GAM模型运行失败以外(获取参数困难),其余9种模型均正常运行,AUC和TSS的统计结果如表1所列。9种成功运行的模型中GBM模型的模拟效果最佳,TSS平均值为0.846,AUC平均值为0.948,变异系数分别为4.2%和1.7% (表1),这表示GBM模型在多次运行模拟中均能够表现出良好的稳定性。此外,RF和MARS模型的模拟结果也较为稳定,属次优模型,即可以在一定程度上预测黄帚橐吾的分布情况。其余模型的模拟效果则较差,其中GLM、ANN和MaxEnt模型的模拟效果最不理想,TSS均低于0.5,AUC分别为0.667、0.729和0.706,接近于随机分布(AUC = 0.5),基本无法准确模拟黄帚橐吾的空间分布。
表 1 9种模型真实技巧统计值与曲线下面积的描述性统计Table 1. Statistical results of 9 models of BIOMOD based on TSSAUC模型 Model 真实技巧统计值 True skill statistics 曲线下面积 Area under the curve 平均值 Mean 标准差
Standard deviation变异系数 Coefficient of variation 平均值 Mean 标准差
Standard deviation变异系数 Coefficient of variation 广义加性模型
Generalized additive model, GLM0.335 0.174 0.520 0.667 0.087 0.130 推进式回归树模型 Generalized boosted regression models, GBM 0.846 0.036 0.042 0.948 0.016 0.017 分类树分析模型 Classification
tree analysis, CTA0.690 0.086 0.125 0.889 0.034 0.039 人工神经网络模型 Artificial
neural network, ANN0.424 0.170 0.401 0.729 0.109 0.150 表面分布区分室模型
Surface range envelope, SRE0.612 0.068 0.112 0.806 0.034 0.042 弹性判别分析模型 Flexible
discriminant analysis,FDA0.774 0.033 0.043 0.909 0.024 0.026 多元适应回归样条函数 Multiple adaptive regression splines, MARS 0.785 0.142 0.181 0.925 0.046 0.049 随机森林模型 Random forest, RF 0.821 0.052 0.063 0.933 0.029 0.031 最大熵模型 Maximum
entropy, MaxEnt0.429 0.058 0.136 0.706 0.022 0.031 2.3 因子重要性
依据不同模型对解释变量各个因子重要性的平均值,并按平均值大小进行降序排列,获取影响黄帚橐吾分布的主要因子,主要有小生境(NDVI最大值、平均值和范围)、年平均辐射、最冷季辐射、最湿季辐射、最湿期降水等(表2)。
表 2 影响因子重要性排序结果Table 2. Importance ranking of factors that affect the distribution of Ligularia virgaurea影响因子 Environmental factor 重要性 Importance 排序 Sorting 归一化植被指数最大值 Normalized differential vegetation index maximum 0.366 0 1 归一化植被指数平均值 Normalized differential vegetation index mean 0.288 0 2 归一化植被指数范围 Normalized differential vegetation index range 0.274 0 3 年平均辐射 Annual mean radiation 0.252 7 4 最大辐射 Maximum radiation 0.246 0 5 最冷季辐射 Coldest season radiation 0.244 2 6 最湿季辐射 Wet season radiation 0.239 1 7 归一化植被指数最小值 Normalized differential vegetation index minimum 0.230 7 8 最湿期降水 Wettest precipitation 0.214 6 9 最湿季平均气温 Wet season average temperature 0.210 2 10 辐射季节性 Radiation seasonality 0.197 9 11 温度年较差 Poor temperature year 0.188 5 12 最暖季辐射 Warmest season radiation 0.187 2 13 最高气温 Highest temperature 0.181 9 14 最干季降水 Dry season precipitation 0.171 5 15 数字高程 Digital elevation 0.167 2 16 年平均气温 Annual average temperature 0.165 7 17 2.4 当前气候下黄帚橐吾潜在分布预测结果
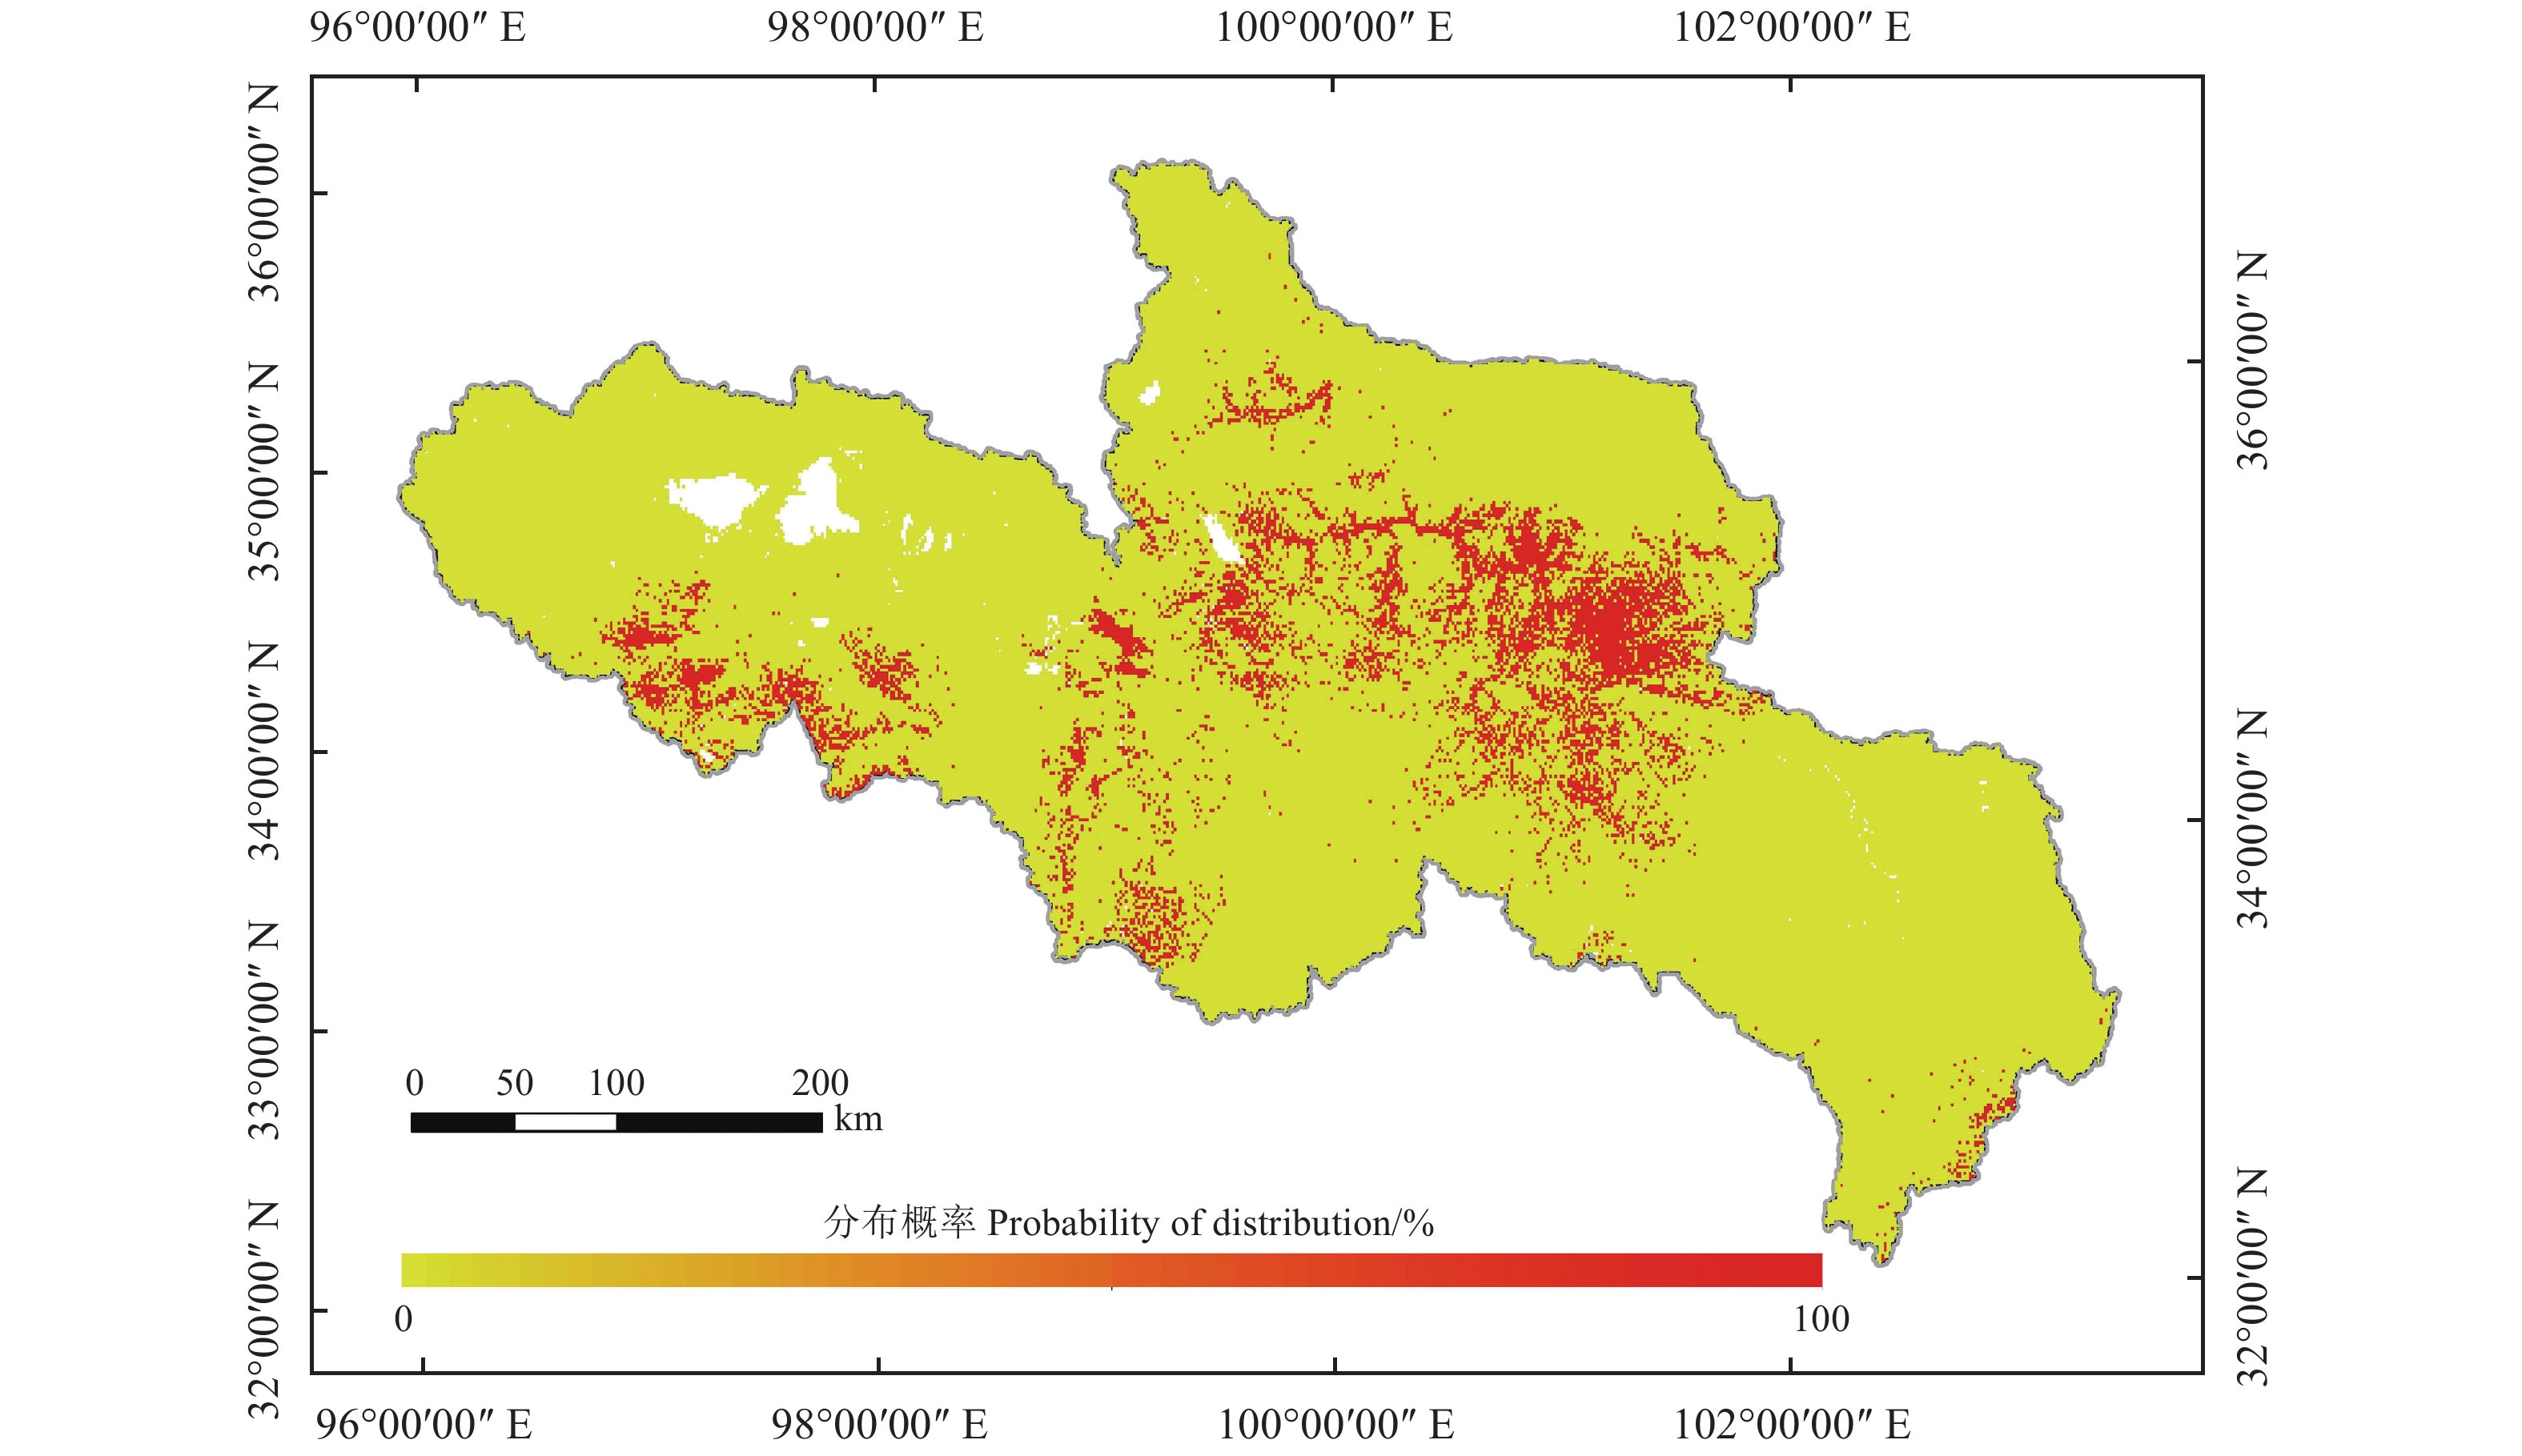
根据模型精度的评估结果,选取表现效果最佳的GBM模型,多次重复运行后,选取GBM模型的最优结果来预测黄帚橐吾的潜在分布并且进行绘图。黄河源区黄帚橐吾潜在分布结果如图5所示,分布概率较高的区域主要集中在黄河源区的中部和西南部,主要包括河南县、玛曲县、同德县、玛沁县和称多县等,在其他区域较低或不存在。
![]() 图 5 基于推进式回归树模型的黄帚橐吾当前潜在分布预测Figure 5. Prediction of the current potential distribution of Ligularia virgaurea based on generalized boosted regression models
图 5 基于推进式回归树模型的黄帚橐吾当前潜在分布预测Figure 5. Prediction of the current potential distribution of Ligularia virgaurea based on generalized boosted regression models2.5 未来气候情景下黄帚橐吾的空间分布预测结果
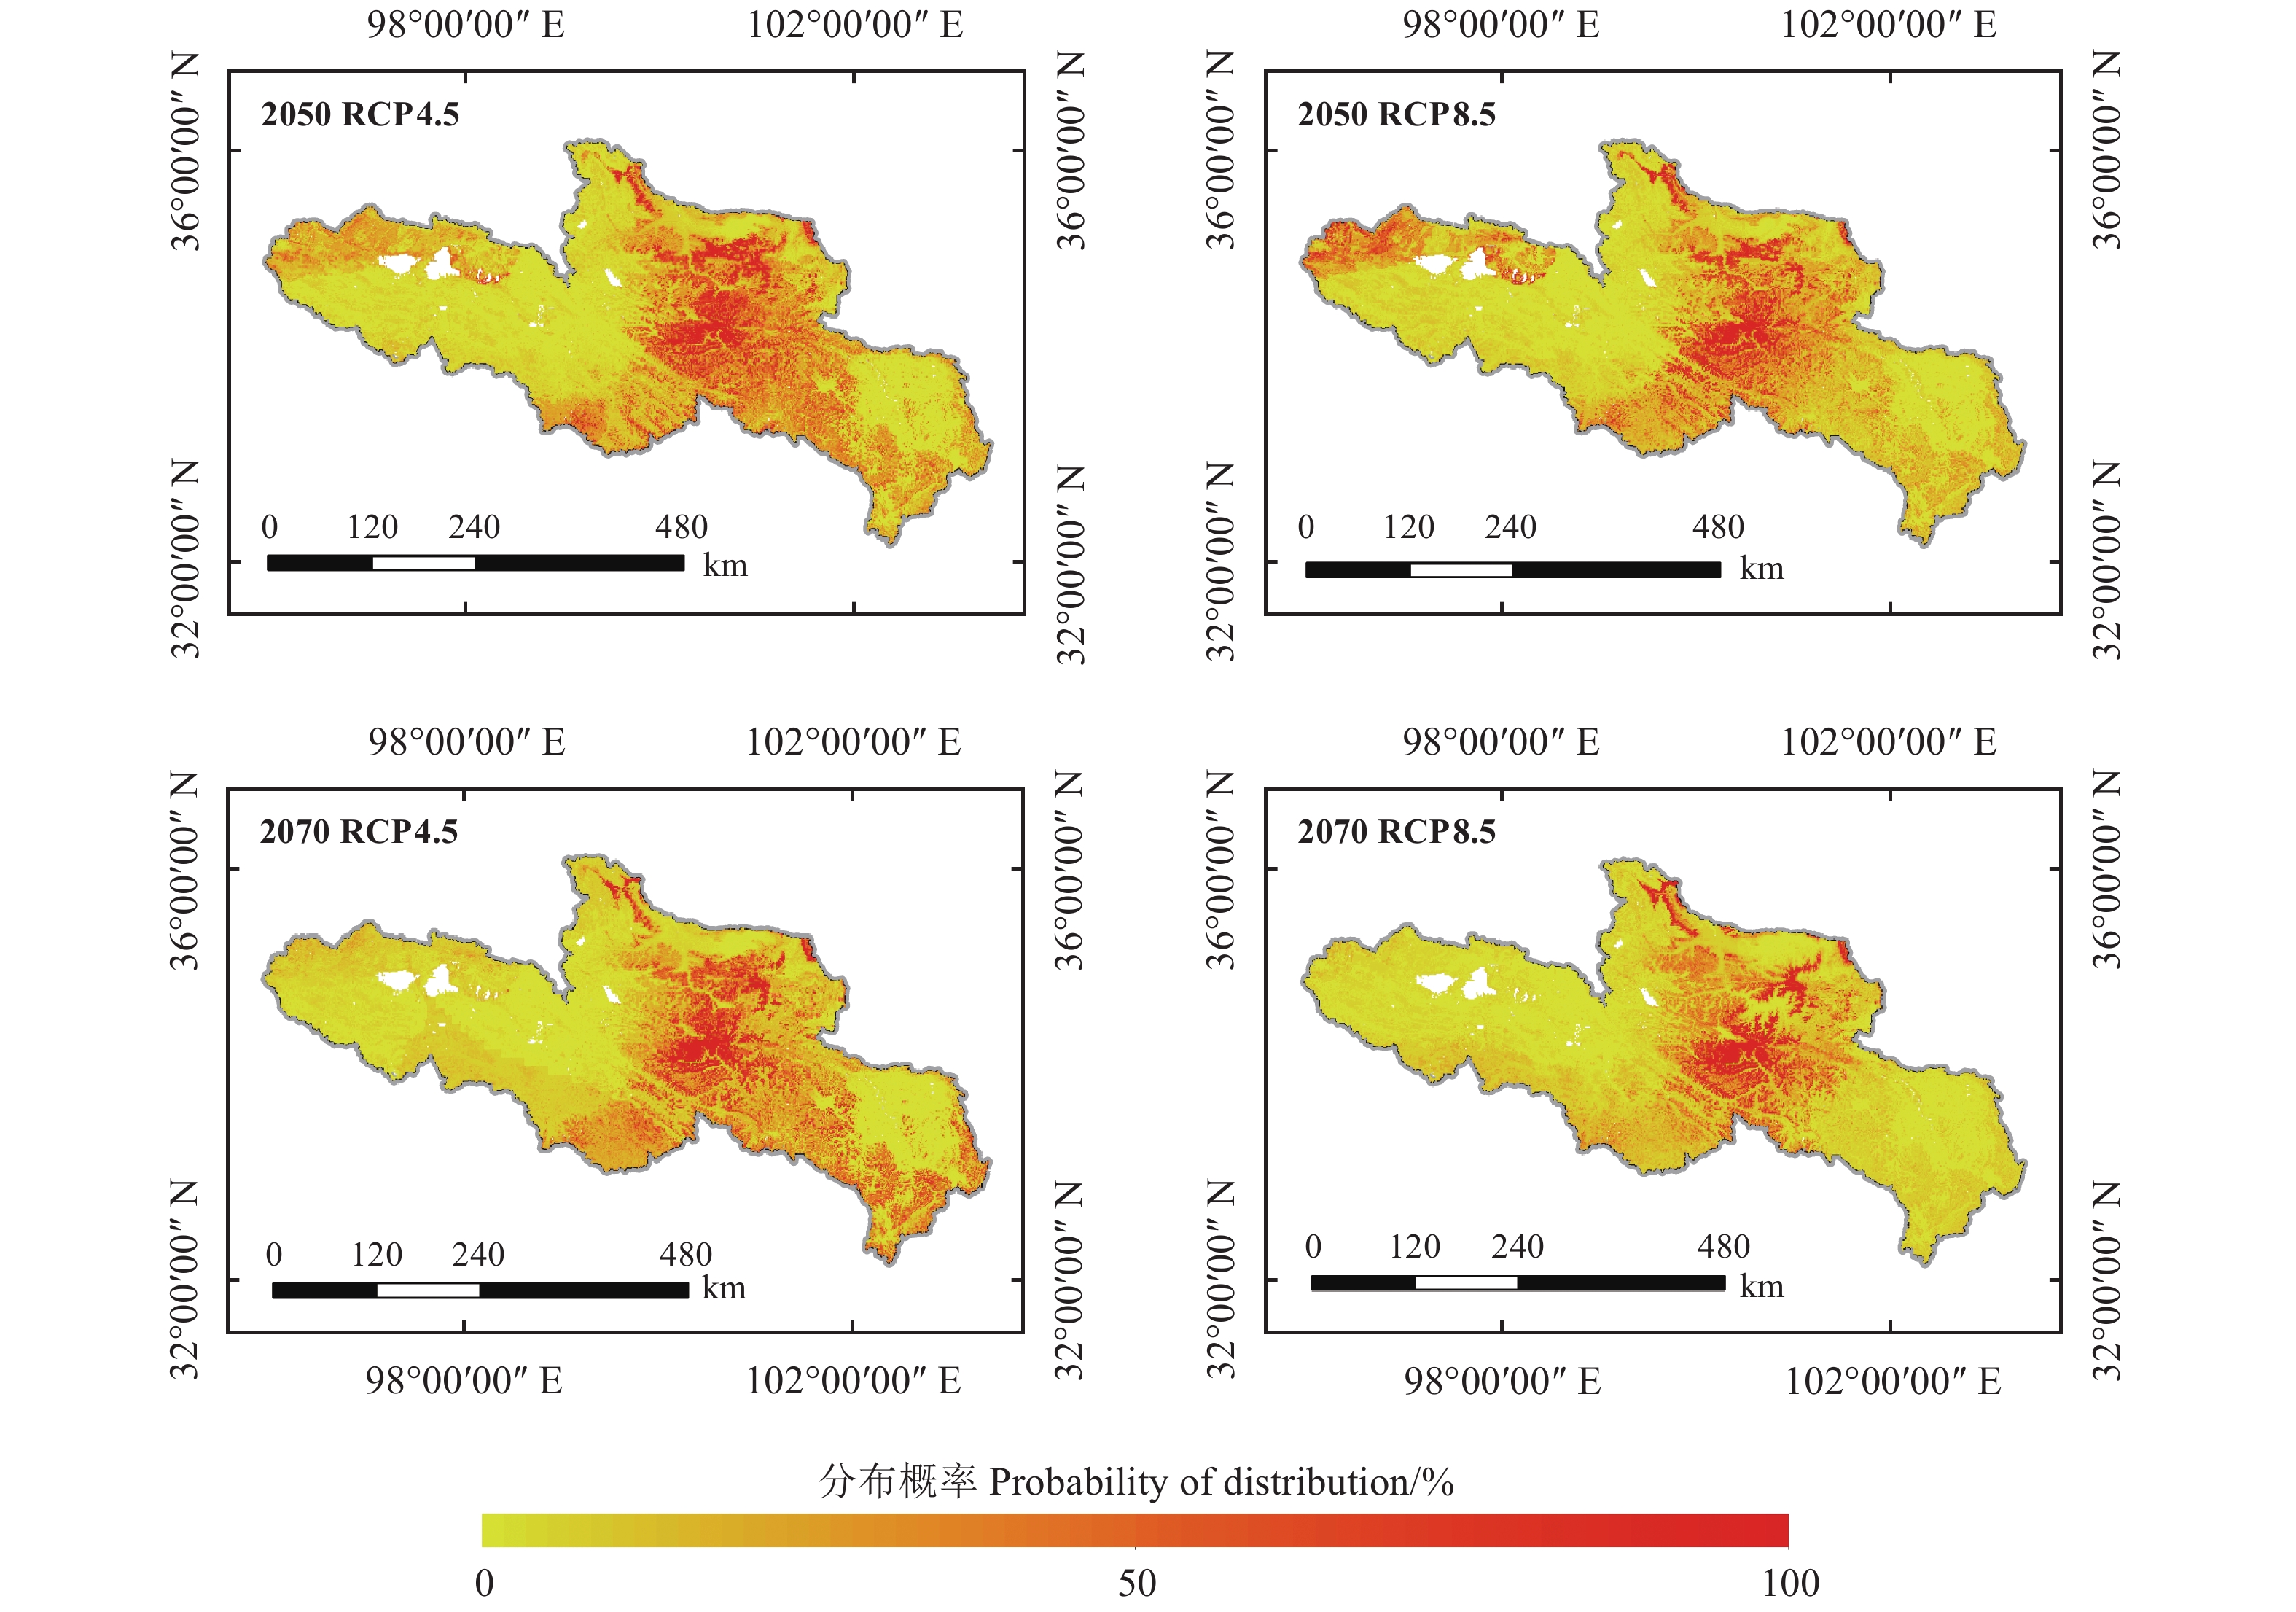
基于BIOMOD的未来气候情景下黄帚橐吾的空间分布预测结果,RF模型整体表现最佳,AUC值为0.939,TSS值为0.835。故采用该模型的预测结果来说明黄河源区黄帚橐吾的空间分布对气候变化的响应。
如图6所示,未来气候情景下,在RCP 4.5情景下,2050年和2070年黄帚橐吾集中分布在黄河源区中部,但是2070年的分布概率相比于2050年整体有所降低,主要体现在黄河源区的西北部;在RCP 8.5情景下,2050年的分布概率较集中,体现在黄河源区中部以及西北部,而2070年的分布则主要集中在黄河源区中部,且呈减少趋势。
![]() 图 6 基于随机森林模型的黄帚橐吾未来分布预测Figure 6. Random forest model-based prediction of the future distribution of Ligularia virgaurea
图 6 基于随机森林模型的黄帚橐吾未来分布预测Figure 6. Random forest model-based prediction of the future distribution of Ligularia virgaurea3. 讨论
3.1 黄河源区黄帚橐吾时空分布
BIOMOD模型的核心驱动数据为各个观测点目标物种是否出现,并基于生态位原理[15-17],结合相关的环境变量构建模型判断目标物种的生态需求,再将结果投射不同的空间和时间来预测物种的分布。本研究发现,在不能完全确定的情况下,用3株黄帚橐吾作为评判存在与否的准确度和效率较高,第一类误差和第二类误差均较低且均匀。这一结果有助于指导基于无人机航拍照片确定物种基础分布数据的准确提取。
本研究基于BIOMOD模型集成的10种物种分布模型,对黄河源区黄帚橐吾的潜在分布以及气候变化背景下未来可能的分布情况进行了模拟。在进行黄帚橐吾潜在分布模拟时,GAM模型是将因变量对每个自变量绘制一条平滑曲线,再将结果相加,本研究中BIOMOD模型未能运行成功,原因可能是GAM模型参数获取困难[35]。GBM模型运用推进方法对多个简单模型进行拟合,然后综合各个结果形成最优化的响应预测[48],在本研究潜在分布预测中综合表现最佳,且多次运行均能保持良好的稳定性。GBM模拟结果显示,当前黄帚橐吾主要分布于黄河源区的中部和西南部,即河南县、玛曲县、玛沁县、称多县等。决定这一分布格局的主要因子是其生存的小生境(NDVI最大值、平均值和范围)、年平均辐射、最冷季辐射、最湿季辐射、最湿期降水等。已有研究发现光照对黄帚橐吾的克隆生长相对速率有显著影响,在不同水热条件下生殖分配的转化可能是其影响机制所在[51],但有待于进一步研究。
用BCC-CSM1.1气候模式分别模拟在RCP 4.5和RCP 8.5情景下(未考虑NDVI等的改变)黄帚橐吾在2050年和2070年的空间分布,表现最佳的模型是RF。RF模型的模拟结果显示,在RCP 4.5情境下黄帚橐吾的分布区更广,尤其在黄河源区的南部;而在RCP 8.5情景下,尽管在2050年,黄河源区的西北部(主要是曲麻莱县)出现了较多的黄帚橐吾,但总体还是主要集中在黄河源区中部偏南的区域,而且两个时间节点均显示RCP 4.5情景下黄帚橐吾的分布更广。预测结果印证了气候变化会改变物种分布的适宜环境和生存范围的极限,进而使得物种得到重新分布的结论[52],但具体过程尚待进一步研究。
3.2 无人机为BIOMOD提供基础数据
BIOMOD被广泛应用于生物物种的分布模拟中[19],而目标物种时空分布基础输入数据的缺失直接决定其适用范围和模拟结果的准确性。传统的植物时空分布调查取样方法主要是人工原地(in situ)取样[22],人力、物力投入大且取样效率低下的缺点明显,而且因为取样人员认知、能力差异等原因导致调查结果可比性较差[21]。加之实地取样受限于河流、围栏等阻隔,且导致植被生境改变,因此无法在区域尺度上开展大规模的基础数据获取工作。本研究借助成熟的FragMAP,将黄帚橐吾取样的过程有机拆分为野外取样和室内信息提取两个过程[29]。一方面,在大幅提高野外采集样品(照片)效率的同时,有效减少了工作人员的活动范围和空间限制,同时节约大量人力、物力,并避免给研究区带来不必要的破坏;另一方面,FragMAP可提供标准统一、长期、定点的BIOMOD模型所需基础数据,保证了数据的准确和统一性,又为后期的模型验证奠定基础。信息提取则利用室内时间灵活、标准相对统一的优势,保证信息提取的效率和准确性。因此,无人机技术与BIOMOD结合能够更好地控制监测成本、提升工作效率并提高模拟的准确性,为区域尺度尤其是环境恶劣区域的物种分布研究提供新的思路和方法。
3.3 存在问题及研究展望
本研究主要基于气候、植被、地形和土壤等自然因子对黄帚橐吾的时空分布进行了模拟。实际上,黄帚橐吾的时空分布除了与其所处的自然环境有关外,与人类活动的干扰也密切相关,比如家畜放牧可能显著引起黄帚橐吾个体性状和时空分布的变化[6, 11]。目前尚没有可以量化、适宜应用于BIOMOD的人为活动因子的数据集,因而可能导致研究结果有一定的偏差。在后期的研究中,应寻找适宜表征人类活动的指标,并将其应用于实际的植物物种时空分布模型,从而进一步提高预测的准确性。
以FragMAP系统控制无人机获取采样点信息为基础,本研究基于大量实测的黄帚橐吾分布概率数据集作为初始驱动数据,但样本多沿公路布局,分布均匀度较差,因而黄帚橐吾真实空间分布的分析可能存在一定的局限性。在今后的研究和数据采集过程中,提升样本分布的均匀性可能会进一步提升植物时空分布预测的准确性。
本研究主要采用人工目视识别的方法进行黄帚橐吾信息的提取,效率较为低下。因此,在进一步的研究工作中,依靠Proposal Classifier获取的大量训练样本(手动选定的黄帚橐吾可自动提取保存)将在后续图像自动识别工作中起到关键作用[29, 53],如可通过卷积神经网络(Convolution neural network)、随机森林(Random forest)等机器学习算法实现[54]。
4. 结论
BIOMOD中GBM和RF模型分别在模拟黄河源区黄帚橐吾当前和未来时空分布时表现最优,影响黄帚橐吾分布的主要因子有小生境(NDVI最大值、平均值和范围)、年平均辐射、最冷季辐射、最湿季辐射、最湿期降水等。当前黄帚橐吾主要分布于黄河源区中部及西南部,其在RCP 4.5情境比RCP 8.5情景分布更广。研究结果可为黄河源区黄帚橐吾时空分布特征、形成机制、致害等级评价等研究提供基础,为黄帚橐吾的合理管理、适时防治提供科学依据,也为该区域草地生态系统和畜牧业的可持续发展提供科学依据。同时,基于FragMAP系统获取大量标准统一、时间序列长、尺度大、精度高的航拍照片为BIOMOD模型提供充足有效的数据基础,为草地生态系统生物多样性的研究和保护提供了新方法和手段。无人机技术发展可大幅提升BIOMOD应用范围的扩展及准确性的提高,未来在大尺度生物物种时空分布、人为因素量化和观测目标的自动识别方面将受到研究人员、草地管理以及决策人员的关注和深入研究。
参考文献
[1] 丁永建, 杨建平, 刘时银, 陈仁升, 王根绪, 沈永平, 王建, 谢昌卫, 张世强. 长江黄河源区生态环境范围的探讨. 地理学报, 2003, 58(4): 519-526. doi: 10.3321/j.issn:0375-5444.2003.04.005 DING Y J, YANG J P, LIU S Y, CHEN R S, WANG G X, SHEN Y P, WANG J, XIE C W, ZHANG S Q. Discussion on the range of ecological environment in the source region of the Yangtze River and Yellow River. Acta Geographica Sinica, 2003, 58(4): 519-526. doi: 10.3321/j.issn:0375-5444.2003.04.005
[2] 任继周, 林慧龙. 江河源区草地生态建设构想. 草业学报, 2005, 14(2): 1-8. doi: 10.3321/j.issn:1004-5759.2005.02.001 REN J Z, LIN H L. Conception of grassland ecological construction in the source area of the river. Acta Prataculturae Sinica, 2005, 14(2): 1-8. doi: 10.3321/j.issn:1004-5759.2005.02.001
[3] 陈全功. 江河源区草地退化与生态环境的综合治理. 草业学报, 2007, 16(1): 10-15. doi: 10.3321/j.issn:1004-5759.2007.01.002 CHEN Q G. Grassland degradation and comprehensive management of ecological environment in the source region of the river. Acta Prataculturae Sinica, 2007, 16(1): 10-15. doi: 10.3321/j.issn:1004-5759.2007.01.002
[4] WANG P, LASSOIE P J, MORREALE J S, DONG S K. A critical review of socioeconomic and natural factors in ecological degradation on the Qinghai-Tibetan Plateau, China. The Rangeland Journal, 2015, 37(1): 1-9. doi: 10.1071/RJ14094
[5] LIU S B, ZAMANIAN K, SCHLEUSS P, ZAREBANADKOUKI M, KUZYAKOV Y. Degradation of Tibetan grasslands: Consequences for carbon and nutrient cycles. Agriculture, Ecosystems and Environment, 2018, 252: 93-104. doi: 10.1016/j.agee.2017.10.011
[6] 刘左军, 杜国祯, 陈家宽. 不同生境下黄帚橐吾(Ligularia virgaurea)个体大小依赖的繁殖分配. 植物生态学报, 2002, 26(1): 44-50. doi: 10.3321/j.issn:1005-264X.2002.01.008 LIU Z J, DU G Z, CHEN J K. Individual size-dependent reproduction and distribution of Ligularia virgaurea in different habitats. Journal of Plant Ecology, 2002, 26(1): 44-50. doi: 10.3321/j.issn:1005-264X.2002.01.008
[7] 单保庆, 杜国祯, 刘振恒. 不同养分条件下和不同生境类型中根茎草本黄帚橐吾的克隆生长. 植物生态学报, 2000, 24(1): 46-51. doi: 10.3321/j.issn:1005-264X.2000.01.009 SHAN B Q, DU G Z, LIU Z H. The clonal growth of rhizome herb Ligularia dulcis under different nutrient conditions and different habitat types. Journal of Plant Ecology, 2000, 24(1): 46-51. doi: 10.3321/j.issn:1005-264X.2000.01.009
[8] 马瑞君, 王明理, 赵坤, 郭守军, 赵庆芳, 孙坤. 高寒草场优势杂草黄帚橐吾水浸液对牧草的化感作用. 应用生态学报, 2006, 17(5): 845-850. doi: 10.3321/j.issn:1001-9332.2006.05.018 MA R J, WANG M L, ZHAO K, GUO S J, ZHAO Q F, SUN K. Allelopathic effects of the water infusion of the dominant weed of the yellow broom Ligularia on alpine grassland. Journal of Applied Ecology, 2006, 17(5): 845-850. doi: 10.3321/j.issn:1001-9332.2006.05.018
[9] 黄立铭. 黄南州天然草地毒草调查与防治. 四川草原, 2006, 5: 24-26. HUANG L M. Investigation and control of poisonous weeds in natural grassland in Huangnan Prefecture. Sichuan Grassland, 2006, 5: 24-26.
[10] 石国玺. 高寒草甸退化指示物种黄帚橐吾的菌根生态学研究. 兰州: 兰州大学博士学位论文, 2014. SHI G X. Mycorrhizal ecology research on degradation of alpine meadow, Ligularia humilis. PhD Thesis. Lanzhou: Lanzhou University, 2014.
[11] 宋仁德, 长谷川信美, 李国梅, 徐宁, 才尕, 张青兰. 天然草地放牧牦牛采食行为及食性选择的研究. 家畜生态学报, 2008, 29(5): 31-35. doi: 10.3969/j.issn.1673-1182.2008.05.006 SONG R D, HASAGAWA N, LI G M, XU N, Caiga, ZHANG Q L. Botanical composition and grazing behaviour of Qinghai yaks of plateau type in the natural rangeland. Acta Ecologae Animalis Domastici, 2008, 29(5): 31-35. doi: 10.3969/j.issn.1673-1182.2008.05.006
[12] 林永明. 牛羊黄帚橐吾草中毒病的发生与诊治. 中国畜禽种业, 2011, 7(2): 73. doi: 10.3969/j.issn.1673-4556.2011.02.042 LIN Y M. Occurrence, diagnosis and treatment of poisonous diseases of Ligularia diffusa. China Livestock and Poultry Industry, 2011, 7(2): 73. doi: 10.3969/j.issn.1673-4556.2011.02.042
[13] 杨建美, 陈学林, 张慕华, 董平, 温发昕. 青藏高原东缘黄帚橐吾种子的形态分化研究. 西北农林科技大学学报(自然科学版), 2010, 38(1): 60-66. YANG J M, CHEN X L, ZHANG M H, DONG P, WEN F X. Morphological differentiation of Ligularia humilis seeds on the eastern edge of the Tibetan Plateau. Journal of Northwest Agriculture and Forestry University (Natural Science Edition), 2010, 38(1): 60-66.
[14] 陈子萱, 田福平, 郑阳. 施肥对玛曲高寒沙化草地主要植物种生态位的影响. 草地学报, 2011, 19(5): 884-888. doi: 10.11733/j.issn.1007-0435.2011.05.029 CHEN Z X, TIAN F P, ZHENG Y. Effects of fertilization on the niche of main plant species in the alpine desertification grassland of Maqu. Acta Agrestia Sinica, 2011, 19(5): 884-888. doi: 10.11733/j.issn.1007-0435.2011.05.029
[15] AUSTIN M P. Spatial prediction of species distribution: an interface between ecological theory and statistical modelling. Ecological Modelling, 2002, 157(2): 101-118.
[16] SOBERON J, PETERSON A T. Interpretation of models of fundamental ecological niches and species's distribtional areas. Biodiversity Informatics, 2005, 2: 1-10.
[17] BLACKWELL P, L TD, HIRZEL A H, LAY G L. Habitat suitability modeling and niche theory. Journal of Applied Ecology, 2008, 45(5): 1372-1381. doi: 10.1111/j.1365-2664.2008.01524.x
[18] 李国庆, 刘长成, 刘玉国, 杨军, 张新时, 郭柯. 物种分布模型理论研究进展. 生态学报, 2013, 33(16): 4827-4835. doi: 10.5846/stxb201212031735 LI G Q, LIU C C, LIU Y G, YANG J, ZHANG X S, GUO K. Theoretical research progress on species distribution model. Acta Ecologica Sinica, 2013, 33(16): 4827-4835. doi: 10.5846/stxb201212031735
[19] THUILLER W. BIOMOD-optimizing predictions of species distributions and projecting potential future shifts under global change. Global Change Biology, 2003, 9(10): 1353-1362. doi: 10.1046/j.1365-2486.2003.00666.x
[20] THUILLER W, LAFOURCADE B, ENGLER R, ARAUJO M B. BIOMOD-a platform for ensemble forecasting of species distributions. Ecography, 2009, 32(3): 369-373. doi: 10.1111/j.1600-0587.2008.05742.x
[21] ROMINGER K, MEYER S. Application of UAV-based methodology for census of an endangered plant species in a fragile habitat. Remote Sensing, 2019, 11(6): 719. doi: 10.3390/rs11060719
[22] SUN Y, YI S H, HOU F J. Unmanned aerial vehicle methods makes species composition monitoring easier in grasslands. Ecological Indicators, 2018, 95: 825-830. doi: 10.1016/j.ecolind.2018.08.042
[23] SUN Y, HOU F J, ANGERER J P, YI S H. Effects of topography and land-use patterns on the spatial heterogeneity of terracette landscapes in the Loess Plateau, China. Ecological Indicators, 2020, 109: 105839. doi: 10.1016/j.ecolind.2019.105839
[24] YI S H. FragMAP: A tool for long-term and cooperative monitoring and analysis of small-scale habitat fragmentation using an unmanned aerial vehicle. International Journal of Remote Sensing, 2017, 38(8/10): 2686-2697. doi: 10.1080/01431161.2016.1253898
[25] CHEN J J, YI S H, QIN Y, WANG X Y. Improving estimates of fractional vegetation cover based on UAV in alpine grassland on the Qinghai-Tibetan Plateau. International Journal of Remote Sensing, 2016, 37(8): 1922-1936. doi: 10.1080/01431161.2016.1165884
[26] YI S H, CHEN J J, QIN Y, XU G W. The burying and grazing effects of plateau pika on alpine grassland are small: A pilot study in a semiarid basin on the Qinghai-Tibet Plateau. Biogeosciences, 2016, 13(22): 6273-6284. doi: 10.5194/bg-13-6273-2016
[27] QIN Y, YI S H, DING Y J, QIN Y, ZHANG W, SUN Y, HOU X M, MENG B P, ZHANG H F, CHEN J J, WANG Z W. Effects of plateau pikas' foraging and burrowing activities on vegetation biomass and soil organic carbon of alpine grasslands. Plant and Soil, 2020: 1-16.
[28] ZHANG H F, SUN Y, CHANG L, QIN Y, CHEN J J, QIN Y, DU J X, YI S H, WANG Y L. Estimation of grassland canopy height and aboveground biomass at the quadrat scale using Unmanned Aerial Vehicle. Remote Sensing, 2018, 10(6): 851. doi: 10.3390/rs10060851
[29] 高姻燕, 马青山, 张欣雨, 马建海, 宜树华, 李葆春, 张建国, 卢霞梦, 孙义. 基于无人机的草原毛虫监测初探. 草业科学, 2020, 37(10): 2106-2114. doi: 10.11829/j.issn.1001-0629.2019-0202 GAO Y Y, MA Q S, ZHANG X Y, MA J H, YI S H, LI B C, ZHANG J G, LU X M, SUN Y. Primary exploration of Gynaephora alpherakii monitoring based on unmanned aerial vehicles (UAV). Pratacultural Science, 2020, 37(10): 2106-2114. doi: 10.11829/j.issn.1001-0629.2019-0202
[30] LI Q, YANG M X, WAN G N, WANG X J. Spatial and temporal precipitation variability in the source region of the Yellow River. Environmental Earth Sciences, 2016, 75(7): 594. doi: 10.1007/s12665-016-5583-8
[31] 蓝永超, 朱云通, 刘根生, 喇承芳, 沈永平, 石明星. 黄河源区气候变化的季节特征与区域差异研究. 冰川冻土, 2016, 38(3): 741-749. LAN Y C, ZHU Y T, LIU G S, LA C F, SHEN Y P, SHI M X. Seasonal characteristics and regional differences of climate change in the source region of the Yellow River. Journal of Glaciology and Geocryology, 2016, 38(3): 741-749.
[32] YU G A, BRIERLEY G, HUANG H Q, WANG Z Y, BLUE B, MA Y X. An environmental gradient of vegetative controls upon channel planform in the source region of the Yangtze and Yellow Rivers. Catena, 2014, 119(8): 143-153.
[33] YANG K, HE J, TANG W J, QIN J, CHENG C K. On downward shortwave and longwave radiations over high altitude regions: Observation and modeling in the Tibetan Plateau. Agricultural and Forest Meteorology, 2010, 150(1): 38-46. doi: 10.1016/j.agrformet.2009.08.004
[34] CHEN Y Y, YANG K, HE J, QIN J, SHI J C, DU J Y, HE Q. Improving land surface temperature modeling for dry land of China. Jounal of Geophysical Research, 2011, 116(2): D20104.
[35] 杜嘉星, 孙义, 向波, 陈建军, 秦彧, 侯秀敏, 于红妍, 宜树华. 基于BIOMOD的黄河源区高原鼠兔潜在分布及其影响因子. 草业科学, 2019, 36(4): 1074-1083. doi: 10.11829/j.issn.1001-0629.2019-0056 DU J X, SUN Y, XIANG B, CHEN J J, QIN Y, HOU X M, YU H Y, YI S H. Potential distribution of plateau pika and its influence factors in the source region of the Yellow River Basin using BIOMOD. Pratacultural Science, 2019, 36(4): 1074-1083. doi: 10.11829/j.issn.1001-0629.2019-0056
[36] 梁天刚, 崔霞, 冯琦胜, 王莺, 夏文韬. 2001−2008年甘南牧区草地地上生物量与载畜量遥感动态监测. 草业科学, 2009, 18(6): 12-22. LIANG T G, CUI X, FENG Q S, WANG Y, XIA W T. Remotely sensed dynamics monitoring of grassland aboveground biomass and carrying capacity during 2001−2008 in Gannan pastoral area. Pratacultural Science, 2009, 18(6): 12-22.
[37] HENGL T, MENDES DE J J, HEUVELINK G B, RUIPEREZ G M, KILIBARDA M, BLAGOTIC A, SHANGGUAN W, WRIGHT M N, GENG X Y, BAUER-MARSCHALLINGER B, GUEVARA M A, VARGAS R, MACMILLAN R A, BATJES N H, LEENAARS J G, RIBEIRO E, WHEELER I, MANTEL S, KEMPEN B. Soil Grids 250m: Global gridded soil information based on machine learning. PLoS One, 2017, 12(2): e0169748.
[38] GAO X J, WANG M L, FILIPPO G. Climate change over China in the 21st century as simulated by BCC_CSM1.1-RegCM4.0. Atmospheric and Oceanic Science Letters, 2013, 6(5): 381-386. doi: 10.1080/16742834.2013.11447112
[39] HAMADA M, NELDER J A. Generalized linear models for quality-improvement experiments. Journal of Quality Technology, 1997, 29(3): 292-304. doi: 10.1080/00224065.1997.11979770
[40] YAO X. Evolving artificial neural networks. Proceedings of the Institute of Electrical and Electronics Engineers, 1999, 87(9): 1423-1447. doi: 10.1109/5.784219
[41] HASTIE T J, TIBSHIRANI R J. Generalized additive model//ARMITAGE P, COLTON T.(eds). Encyclopedia of Biostatistics. 2nd ed. Hoboken: John Wiley and Sons, Ltd., 2005.
[42] ELITH J, LEATHWICK J R, HASTIE T. A working guide to boosted regression trees. Journal of Animal Ecology, 2008, 77(4): 802-813. doi: 10.1111/j.1365-2656.2008.01390.x
[43] DE'ATH G, FABRICIUS E K. Classification and regression trees: A powerful yet simple technique for ecological analysis. Ecology, 2000, 81(11): 3178-3192. doi: 10.1890/0012-9658(2000)081[3178:CARTAP]2.0.CO;2
[44] 胥勇, 平阳, 王扬, 陈志星, 马荣, 喻盛甫. 应用BIOCLIM生态位模型对松材线虫传入云南的风险评估. 云南农业大学学报, 2008, 23(6): 746-753. XU Y, PING Y, WANG Y, CHEN Z X, MA R, YU S F. Risk assessment of the introduction of pine wood nematodes into Yunnan using the BIOCLIM niche model. Journal of Yunnan Agricultural University, 2008, 23(6): 746-753.
[45] BREIMAN L. Bagging predictors. Machine Learning, 1996, 24(2): 123-140.
[46] HASTIE T, TIBSHIRANI R, BUJA A. Flexible discriminant analysis by optimal scoring. Journal of the American Statistical Association, 1994, 89(428): 1255-1270. doi: 10.1080/01621459.1994.10476866
[47] PHILLIPS S J, ANDERSON R P, SCHAPIRE R E. Maximum entropy modeling of species geographic distributions. Ecological Modelling, 2006, 190(3): 231-259.
[48] FRIEDMAN J H. Multivariate adaptive regression splines. Annals of Statistics, 1991, 19: 1-67. doi: 10.1214/aos/1176347963
[49] FAWCETT T. An introduction to ROC analysis. Pattern Recognition Letters, 2006, 27(8): 861-874. doi: 10.1016/j.patrec.2005.10.010
[50] ALLOUCHE O, TSOAR A, KADMON R. Assessing the accuracy of species distribution models: Prevalence, kappa and the true skill statistic (TSS). Journal of Applied Ecology, 2006, 43(6): 1223-1232. doi: 10.1111/j.1365-2664.2006.01214.x
[51] 王满堂, 赵全科, 程栋梁. 黄帚橐吾基株克隆生长对不同光照的响应. 草业科学, 2018, 35(2): 357-362. doi: 10.11829/j.issn.1001-0629.2017-0215 WANG M T, ZHAO Q K, CHENG D L. Response on the clonal growth of Ligularia virgaurea genets to light intensity. Pratacultural Science, 2018, 35(2): 357-362. doi: 10.11829/j.issn.1001-0629.2017-0215
[52] 魏彦强, 芦海燕, 王金牛, 孙建, 王旭峰. 近35年青藏高原植被带变化对气候变化及人类活动的响应. 草业科学, 2019, 36(4): 1163-1176. WEI Y Q, LU H Y, WANG J N, SUN J, WANG X F. Responses of vegetation zones, in the Qinghai-Tibetan Plateau, to climate change and anthropogenic influences over the last 35 years. Pratacultural Science, 2019, 36(4): 1163-1176.
[53] YANG Y, XI X, ZHONG X, EISENHAUER N, SUN S. N addition suppresses the performance of grassland caterpillars (Gynaephora alpherakjj) by decreasing ground temperature. Ecosphere, 2017, 8(3): e01755. doi: 10.1002/ecs2.1755
[54] JAKOVLJEVIC G, GOVEDARICA M, ALVAREZ-TABOADA F. A deep learning model for automatic plastic mapping using Unmanned Aerial Vehicle (UAV) data. Remote Sensing, 2020, 12(9): 1515. doi: 10.3390/rs12091515
-
![]()
图 2 基于无人机的协同航拍和分析系统的Belt航线设置示意图
(a)基于FragMAP系统的Belt模式的航拍路径;(b)随机选取15条航线的6、7、10、11航点放置样方框;(c)基于Belt模式获取的样方框区域的航拍照片。
Figure 2. Belt mode based on FragMAP
(a) the aerial route of the belt mode of the FragMAP system; (b) 15 routes were randomly selected, and 6, 7, 10, and 11 waypoints were selected for quadrats; (c) the aerial photograph of the quadrat area.
![]()
图 3 基于无人机的协同航拍和分析系统的Proposal-Classifier工具提取黄帚橐吾信息
Figure 3. Extracting information from Ligularia virgaurea based on the Proposal-Classifier of FragMAP system
![]()
图 4 不同基础植株数量判定黄帚橐吾出现与否的准确率
+ 表示将没有黄帚橐吾的样方框认定为存在(第一类误差);○ 表示认定正确;− 表示将有黄帚橐吾的样方认定为不存在(第二类误差)。
Figure 4. The accuracy rate of the presence/absence data of Ligularia virgaurea based on different plant numbers
+ means “no L. virgaurea” was mistakenly identified as “L. virgaurea” (type Ⅰ error); ○ means identified correctly; − means “L. virgaurea” was identified mistakenly as “no L. virgaurea” (type Ⅱ error).
![]()
图 5 基于推进式回归树模型的黄帚橐吾当前潜在分布预测
Figure 5. Prediction of the current potential distribution of Ligularia virgaurea based on generalized boosted regression models
![]()
图 6 基于随机森林模型的黄帚橐吾未来分布预测
Figure 6. Random forest model-based prediction of the future distribution of Ligularia virgaurea
表 1 9种模型真实技巧统计值与曲线下面积的描述性统计
Table 1 Statistical results of 9 models of BIOMOD based on TSSAUC
模型 Model 真实技巧统计值 True skill statistics 曲线下面积 Area under the curve 平均值 Mean 标准差
Standard deviation变异系数 Coefficient of variation 平均值 Mean 标准差
Standard deviation变异系数 Coefficient of variation 广义加性模型
Generalized additive model, GLM0.335 0.174 0.520 0.667 0.087 0.130 推进式回归树模型 Generalized boosted regression models, GBM 0.846 0.036 0.042 0.948 0.016 0.017 分类树分析模型 Classification
tree analysis, CTA0.690 0.086 0.125 0.889 0.034 0.039 人工神经网络模型 Artificial
neural network, ANN0.424 0.170 0.401 0.729 0.109 0.150 表面分布区分室模型
Surface range envelope, SRE0.612 0.068 0.112 0.806 0.034 0.042 弹性判别分析模型 Flexible
discriminant analysis,FDA0.774 0.033 0.043 0.909 0.024 0.026 多元适应回归样条函数 Multiple adaptive regression splines, MARS 0.785 0.142 0.181 0.925 0.046 0.049 随机森林模型 Random forest, RF 0.821 0.052 0.063 0.933 0.029 0.031 最大熵模型 Maximum
entropy, MaxEnt0.429 0.058 0.136 0.706 0.022 0.031  下载: 导出CSV
表 2 影响因子重要性排序结果
Table 2 Importance ranking of factors that affect the distribution of Ligularia virgaurea
影响因子 Environmental factor 重要性 Importance 排序 Sorting 归一化植被指数最大值 Normalized differential vegetation index maximum 0.366 0 1 归一化植被指数平均值 Normalized differential vegetation index mean 0.288 0 2 归一化植被指数范围 Normalized differential vegetation index range 0.274 0 3 年平均辐射 Annual mean radiation 0.252 7 4 最大辐射 Maximum radiation 0.246 0 5 最冷季辐射 Coldest season radiation 0.244 2 6 最湿季辐射 Wet season radiation 0.239 1 7 归一化植被指数最小值 Normalized differential vegetation index minimum 0.230 7 8 最湿期降水 Wettest precipitation 0.214 6 9 最湿季平均气温 Wet season average temperature 0.210 2 10 辐射季节性 Radiation seasonality 0.197 9 11 温度年较差 Poor temperature year 0.188 5 12 最暖季辐射 Warmest season radiation 0.187 2 13 最高气温 Highest temperature 0.181 9 14 最干季降水 Dry season precipitation 0.171 5 15 数字高程 Digital elevation 0.167 2 16 年平均气温 Annual average temperature 0.165 7 17
下载: 导出CSV
-
[1] 丁永建, 杨建平, 刘时银, 陈仁升, 王根绪, 沈永平, 王建, 谢昌卫, 张世强. 长江黄河源区生态环境范围的探讨. 地理学报, 2003, 58(4): 519-526. doi: 10.3321/j.issn:0375-5444.2003.04.005 DING Y J, YANG J P, LIU S Y, CHEN R S, WANG G X, SHEN Y P, WANG J, XIE C W, ZHANG S Q. Discussion on the range of ecological environment in the source region of the Yangtze River and Yellow River. Acta Geographica Sinica, 2003, 58(4): 519-526. doi: 10.3321/j.issn:0375-5444.2003.04.005
[2] 任继周, 林慧龙. 江河源区草地生态建设构想. 草业学报, 2005, 14(2): 1-8. doi: 10.3321/j.issn:1004-5759.2005.02.001 REN J Z, LIN H L. Conception of grassland ecological construction in the source area of the river. Acta Prataculturae Sinica, 2005, 14(2): 1-8. doi: 10.3321/j.issn:1004-5759.2005.02.001
[3] 陈全功. 江河源区草地退化与生态环境的综合治理. 草业学报, 2007, 16(1): 10-15. doi: 10.3321/j.issn:1004-5759.2007.01.002 CHEN Q G. Grassland degradation and comprehensive management of ecological environment in the source region of the river. Acta Prataculturae Sinica, 2007, 16(1): 10-15. doi: 10.3321/j.issn:1004-5759.2007.01.002
[4] WANG P, LASSOIE P J, MORREALE J S, DONG S K. A critical review of socioeconomic and natural factors in ecological degradation on the Qinghai-Tibetan Plateau, China. The Rangeland Journal, 2015, 37(1): 1-9. doi: 10.1071/RJ14094
[5] LIU S B, ZAMANIAN K, SCHLEUSS P, ZAREBANADKOUKI M, KUZYAKOV Y. Degradation of Tibetan grasslands: Consequences for carbon and nutrient cycles. Agriculture, Ecosystems and Environment, 2018, 252: 93-104. doi: 10.1016/j.agee.2017.10.011
[6] 刘左军, 杜国祯, 陈家宽. 不同生境下黄帚橐吾(Ligularia virgaurea)个体大小依赖的繁殖分配. 植物生态学报, 2002, 26(1): 44-50. doi: 10.3321/j.issn:1005-264X.2002.01.008 LIU Z J, DU G Z, CHEN J K. Individual size-dependent reproduction and distribution of Ligularia virgaurea in different habitats. Journal of Plant Ecology, 2002, 26(1): 44-50. doi: 10.3321/j.issn:1005-264X.2002.01.008
[7] 单保庆, 杜国祯, 刘振恒. 不同养分条件下和不同生境类型中根茎草本黄帚橐吾的克隆生长. 植物生态学报, 2000, 24(1): 46-51. doi: 10.3321/j.issn:1005-264X.2000.01.009 SHAN B Q, DU G Z, LIU Z H. The clonal growth of rhizome herb Ligularia dulcis under different nutrient conditions and different habitat types. Journal of Plant Ecology, 2000, 24(1): 46-51. doi: 10.3321/j.issn:1005-264X.2000.01.009
[8] 马瑞君, 王明理, 赵坤, 郭守军, 赵庆芳, 孙坤. 高寒草场优势杂草黄帚橐吾水浸液对牧草的化感作用. 应用生态学报, 2006, 17(5): 845-850. doi: 10.3321/j.issn:1001-9332.2006.05.018 MA R J, WANG M L, ZHAO K, GUO S J, ZHAO Q F, SUN K. Allelopathic effects of the water infusion of the dominant weed of the yellow broom Ligularia on alpine grassland. Journal of Applied Ecology, 2006, 17(5): 845-850. doi: 10.3321/j.issn:1001-9332.2006.05.018
[9] 黄立铭. 黄南州天然草地毒草调查与防治. 四川草原, 2006, 5: 24-26. HUANG L M. Investigation and control of poisonous weeds in natural grassland in Huangnan Prefecture. Sichuan Grassland, 2006, 5: 24-26.
[10] 石国玺. 高寒草甸退化指示物种黄帚橐吾的菌根生态学研究. 兰州: 兰州大学博士学位论文, 2014. SHI G X. Mycorrhizal ecology research on degradation of alpine meadow, Ligularia humilis. PhD Thesis. Lanzhou: Lanzhou University, 2014.
[11] 宋仁德, 长谷川信美, 李国梅, 徐宁, 才尕, 张青兰. 天然草地放牧牦牛采食行为及食性选择的研究. 家畜生态学报, 2008, 29(5): 31-35. doi: 10.3969/j.issn.1673-1182.2008.05.006 SONG R D, HASAGAWA N, LI G M, XU N, Caiga, ZHANG Q L. Botanical composition and grazing behaviour of Qinghai yaks of plateau type in the natural rangeland. Acta Ecologae Animalis Domastici, 2008, 29(5): 31-35. doi: 10.3969/j.issn.1673-1182.2008.05.006
[12] 林永明. 牛羊黄帚橐吾草中毒病的发生与诊治. 中国畜禽种业, 2011, 7(2): 73. doi: 10.3969/j.issn.1673-4556.2011.02.042 LIN Y M. Occurrence, diagnosis and treatment of poisonous diseases of Ligularia diffusa. China Livestock and Poultry Industry, 2011, 7(2): 73. doi: 10.3969/j.issn.1673-4556.2011.02.042
[13] 杨建美, 陈学林, 张慕华, 董平, 温发昕. 青藏高原东缘黄帚橐吾种子的形态分化研究. 西北农林科技大学学报(自然科学版), 2010, 38(1): 60-66. YANG J M, CHEN X L, ZHANG M H, DONG P, WEN F X. Morphological differentiation of Ligularia humilis seeds on the eastern edge of the Tibetan Plateau. Journal of Northwest Agriculture and Forestry University (Natural Science Edition), 2010, 38(1): 60-66.
[14] 陈子萱, 田福平, 郑阳. 施肥对玛曲高寒沙化草地主要植物种生态位的影响. 草地学报, 2011, 19(5): 884-888. doi: 10.11733/j.issn.1007-0435.2011.05.029 CHEN Z X, TIAN F P, ZHENG Y. Effects of fertilization on the niche of main plant species in the alpine desertification grassland of Maqu. Acta Agrestia Sinica, 2011, 19(5): 884-888. doi: 10.11733/j.issn.1007-0435.2011.05.029
[15] AUSTIN M P. Spatial prediction of species distribution: an interface between ecological theory and statistical modelling. Ecological Modelling, 2002, 157(2): 101-118.
[16] SOBERON J, PETERSON A T. Interpretation of models of fundamental ecological niches and species's distribtional areas. Biodiversity Informatics, 2005, 2: 1-10.
[17] BLACKWELL P, L TD, HIRZEL A H, LAY G L. Habitat suitability modeling and niche theory. Journal of Applied Ecology, 2008, 45(5): 1372-1381. doi: 10.1111/j.1365-2664.2008.01524.x
[18] 李国庆, 刘长成, 刘玉国, 杨军, 张新时, 郭柯. 物种分布模型理论研究进展. 生态学报, 2013, 33(16): 4827-4835. doi: 10.5846/stxb201212031735 LI G Q, LIU C C, LIU Y G, YANG J, ZHANG X S, GUO K. Theoretical research progress on species distribution model. Acta Ecologica Sinica, 2013, 33(16): 4827-4835. doi: 10.5846/stxb201212031735
[19] THUILLER W. BIOMOD-optimizing predictions of species distributions and projecting potential future shifts under global change. Global Change Biology, 2003, 9(10): 1353-1362. doi: 10.1046/j.1365-2486.2003.00666.x
[20] THUILLER W, LAFOURCADE B, ENGLER R, ARAUJO M B. BIOMOD-a platform for ensemble forecasting of species distributions. Ecography, 2009, 32(3): 369-373. doi: 10.1111/j.1600-0587.2008.05742.x
[21] ROMINGER K, MEYER S. Application of UAV-based methodology for census of an endangered plant species in a fragile habitat. Remote Sensing, 2019, 11(6): 719. doi: 10.3390/rs11060719
[22] SUN Y, YI S H, HOU F J. Unmanned aerial vehicle methods makes species composition monitoring easier in grasslands. Ecological Indicators, 2018, 95: 825-830. doi: 10.1016/j.ecolind.2018.08.042
[23] SUN Y, HOU F J, ANGERER J P, YI S H. Effects of topography and land-use patterns on the spatial heterogeneity of terracette landscapes in the Loess Plateau, China. Ecological Indicators, 2020, 109: 105839. doi: 10.1016/j.ecolind.2019.105839
[24] YI S H. FragMAP: A tool for long-term and cooperative monitoring and analysis of small-scale habitat fragmentation using an unmanned aerial vehicle. International Journal of Remote Sensing, 2017, 38(8/10): 2686-2697. doi: 10.1080/01431161.2016.1253898
[25] CHEN J J, YI S H, QIN Y, WANG X Y. Improving estimates of fractional vegetation cover based on UAV in alpine grassland on the Qinghai-Tibetan Plateau. International Journal of Remote Sensing, 2016, 37(8): 1922-1936. doi: 10.1080/01431161.2016.1165884
[26] YI S H, CHEN J J, QIN Y, XU G W. The burying and grazing effects of plateau pika on alpine grassland are small: A pilot study in a semiarid basin on the Qinghai-Tibet Plateau. Biogeosciences, 2016, 13(22): 6273-6284. doi: 10.5194/bg-13-6273-2016
[27] QIN Y, YI S H, DING Y J, QIN Y, ZHANG W, SUN Y, HOU X M, MENG B P, ZHANG H F, CHEN J J, WANG Z W. Effects of plateau pikas' foraging and burrowing activities on vegetation biomass and soil organic carbon of alpine grasslands. Plant and Soil, 2020: 1-16.
[28] ZHANG H F, SUN Y, CHANG L, QIN Y, CHEN J J, QIN Y, DU J X, YI S H, WANG Y L. Estimation of grassland canopy height and aboveground biomass at the quadrat scale using Unmanned Aerial Vehicle. Remote Sensing, 2018, 10(6): 851. doi: 10.3390/rs10060851
[29] 高姻燕, 马青山, 张欣雨, 马建海, 宜树华, 李葆春, 张建国, 卢霞梦, 孙义. 基于无人机的草原毛虫监测初探. 草业科学, 2020, 37(10): 2106-2114. doi: 10.11829/j.issn.1001-0629.2019-0202 GAO Y Y, MA Q S, ZHANG X Y, MA J H, YI S H, LI B C, ZHANG J G, LU X M, SUN Y. Primary exploration of Gynaephora alpherakii monitoring based on unmanned aerial vehicles (UAV). Pratacultural Science, 2020, 37(10): 2106-2114. doi: 10.11829/j.issn.1001-0629.2019-0202
[30] LI Q, YANG M X, WAN G N, WANG X J. Spatial and temporal precipitation variability in the source region of the Yellow River. Environmental Earth Sciences, 2016, 75(7): 594. doi: 10.1007/s12665-016-5583-8
[31] 蓝永超, 朱云通, 刘根生, 喇承芳, 沈永平, 石明星. 黄河源区气候变化的季节特征与区域差异研究. 冰川冻土, 2016, 38(3): 741-749. LAN Y C, ZHU Y T, LIU G S, LA C F, SHEN Y P, SHI M X. Seasonal characteristics and regional differences of climate change in the source region of the Yellow River. Journal of Glaciology and Geocryology, 2016, 38(3): 741-749.
[32] YU G A, BRIERLEY G, HUANG H Q, WANG Z Y, BLUE B, MA Y X. An environmental gradient of vegetative controls upon channel planform in the source region of the Yangtze and Yellow Rivers. Catena, 2014, 119(8): 143-153.
[33] YANG K, HE J, TANG W J, QIN J, CHENG C K. On downward shortwave and longwave radiations over high altitude regions: Observation and modeling in the Tibetan Plateau. Agricultural and Forest Meteorology, 2010, 150(1): 38-46. doi: 10.1016/j.agrformet.2009.08.004
[34] CHEN Y Y, YANG K, HE J, QIN J, SHI J C, DU J Y, HE Q. Improving land surface temperature modeling for dry land of China. Jounal of Geophysical Research, 2011, 116(2): D20104.
[35] 杜嘉星, 孙义, 向波, 陈建军, 秦彧, 侯秀敏, 于红妍, 宜树华. 基于BIOMOD的黄河源区高原鼠兔潜在分布及其影响因子. 草业科学, 2019, 36(4): 1074-1083. doi: 10.11829/j.issn.1001-0629.2019-0056 DU J X, SUN Y, XIANG B, CHEN J J, QIN Y, HOU X M, YU H Y, YI S H. Potential distribution of plateau pika and its influence factors in the source region of the Yellow River Basin using BIOMOD. Pratacultural Science, 2019, 36(4): 1074-1083. doi: 10.11829/j.issn.1001-0629.2019-0056
[36] 梁天刚, 崔霞, 冯琦胜, 王莺, 夏文韬. 2001−2008年甘南牧区草地地上生物量与载畜量遥感动态监测. 草业科学, 2009, 18(6): 12-22. LIANG T G, CUI X, FENG Q S, WANG Y, XIA W T. Remotely sensed dynamics monitoring of grassland aboveground biomass and carrying capacity during 2001−2008 in Gannan pastoral area. Pratacultural Science, 2009, 18(6): 12-22.
[37] HENGL T, MENDES DE J J, HEUVELINK G B, RUIPEREZ G M, KILIBARDA M, BLAGOTIC A, SHANGGUAN W, WRIGHT M N, GENG X Y, BAUER-MARSCHALLINGER B, GUEVARA M A, VARGAS R, MACMILLAN R A, BATJES N H, LEENAARS J G, RIBEIRO E, WHEELER I, MANTEL S, KEMPEN B. Soil Grids 250m: Global gridded soil information based on machine learning. PLoS One, 2017, 12(2): e0169748.
[38] GAO X J, WANG M L, FILIPPO G. Climate change over China in the 21st century as simulated by BCC_CSM1.1-RegCM4.0. Atmospheric and Oceanic Science Letters, 2013, 6(5): 381-386. doi: 10.1080/16742834.2013.11447112
[39] HAMADA M, NELDER J A. Generalized linear models for quality-improvement experiments. Journal of Quality Technology, 1997, 29(3): 292-304. doi: 10.1080/00224065.1997.11979770
[40] YAO X. Evolving artificial neural networks. Proceedings of the Institute of Electrical and Electronics Engineers, 1999, 87(9): 1423-1447. doi: 10.1109/5.784219
[41] HASTIE T J, TIBSHIRANI R J. Generalized additive model//ARMITAGE P, COLTON T.(eds). Encyclopedia of Biostatistics. 2nd ed. Hoboken: John Wiley and Sons, Ltd., 2005.
[42] ELITH J, LEATHWICK J R, HASTIE T. A working guide to boosted regression trees. Journal of Animal Ecology, 2008, 77(4): 802-813. doi: 10.1111/j.1365-2656.2008.01390.x
[43] DE'ATH G, FABRICIUS E K. Classification and regression trees: A powerful yet simple technique for ecological analysis. Ecology, 2000, 81(11): 3178-3192. doi: 10.1890/0012-9658(2000)081[3178:CARTAP]2.0.CO;2
[44] 胥勇, 平阳, 王扬, 陈志星, 马荣, 喻盛甫. 应用BIOCLIM生态位模型对松材线虫传入云南的风险评估. 云南农业大学学报, 2008, 23(6): 746-753. XU Y, PING Y, WANG Y, CHEN Z X, MA R, YU S F. Risk assessment of the introduction of pine wood nematodes into Yunnan using the BIOCLIM niche model. Journal of Yunnan Agricultural University, 2008, 23(6): 746-753.
[45] BREIMAN L. Bagging predictors. Machine Learning, 1996, 24(2): 123-140.
[46] HASTIE T, TIBSHIRANI R, BUJA A. Flexible discriminant analysis by optimal scoring. Journal of the American Statistical Association, 1994, 89(428): 1255-1270. doi: 10.1080/01621459.1994.10476866
[47] PHILLIPS S J, ANDERSON R P, SCHAPIRE R E. Maximum entropy modeling of species geographic distributions. Ecological Modelling, 2006, 190(3): 231-259.
[48] FRIEDMAN J H. Multivariate adaptive regression splines. Annals of Statistics, 1991, 19: 1-67. doi: 10.1214/aos/1176347963
[49] FAWCETT T. An introduction to ROC analysis. Pattern Recognition Letters, 2006, 27(8): 861-874. doi: 10.1016/j.patrec.2005.10.010
[50] ALLOUCHE O, TSOAR A, KADMON R. Assessing the accuracy of species distribution models: Prevalence, kappa and the true skill statistic (TSS). Journal of Applied Ecology, 2006, 43(6): 1223-1232. doi: 10.1111/j.1365-2664.2006.01214.x
[51] 王满堂, 赵全科, 程栋梁. 黄帚橐吾基株克隆生长对不同光照的响应. 草业科学, 2018, 35(2): 357-362. doi: 10.11829/j.issn.1001-0629.2017-0215 WANG M T, ZHAO Q K, CHENG D L. Response on the clonal growth of Ligularia virgaurea genets to light intensity. Pratacultural Science, 2018, 35(2): 357-362. doi: 10.11829/j.issn.1001-0629.2017-0215
[52] 魏彦强, 芦海燕, 王金牛, 孙建, 王旭峰. 近35年青藏高原植被带变化对气候变化及人类活动的响应. 草业科学, 2019, 36(4): 1163-1176. WEI Y Q, LU H Y, WANG J N, SUN J, WANG X F. Responses of vegetation zones, in the Qinghai-Tibetan Plateau, to climate change and anthropogenic influences over the last 35 years. Pratacultural Science, 2019, 36(4): 1163-1176.
[53] YANG Y, XI X, ZHONG X, EISENHAUER N, SUN S. N addition suppresses the performance of grassland caterpillars (Gynaephora alpherakjj) by decreasing ground temperature. Ecosphere, 2017, 8(3): e01755. doi: 10.1002/ecs2.1755
[54] JAKOVLJEVIC G, GOVEDARICA M, ALVAREZ-TABOADA F. A deep learning model for automatic plastic mapping using Unmanned Aerial Vehicle (UAV) data. Remote Sensing, 2020, 12(9): 1515. doi: 10.3390/rs12091515
-
期刊类型引用(5)
1. 赵茜蕾,斗尕杰布,沈羽彤,扎西加措,孙子墨,唐凤霓,廖雅芳,刘坤博,党泽加,斗拉加,孙义. 基于无人机采集样本预测黄河源区小花草玉梅的时空分布. 草业科学. 2024(02): 308-321 .  本站查看
本站查看
2. 许静,甘崎旭,李文龙. 高寒/亚高寒草甸植物种子萌发特性及其影响因素. 草业科学. 2023(02): 436-447 . 本站查看
3. 张欣雨,朱泽群,袁雅欣,姬文翔,宋岑雨,陆洪伟,赵茜蕾,卞庆瑶,孙子墨,宜树华,孙义. 基于组合物种分布模型的黄河源区鹅绒委陵菜适宜生境及其对气候变化的响应. 草业科学. 2022(02): 254-267 . 本站查看
4. 宜树华,陈世苹,李英年,胡中民. 中国生态脆弱区联网协同观测及其在承载力研究中的应用. 应用生态学报. 2022(08): 2271-2278 . 百度学术
5. 高瑜,李佳颖,刘宇哲,孟繁蕴. 基于组合模型的丹参潜在地理分布研究. 植物科学学报. 2021(06): 571-579 . 百度学术
其他类型引用(4)


计量
- PDF下载量: 44
- 文章访问数: 2953
- HTML全文浏览量: 934
- 被引次数: 9